


Procurement teams compare optical sorting machines on one line in a quotation: accuracy of 99.9 percent or better. Plant teams later find that the same machine reports a reject rate near one percent, that part of that stream is saleable product, and that nobody can say how many defects actually reached the carton. The gap is rarely a dishonest vendor. It is a measurement problem, because defect escape, good product loss and yield are three separate quantities that one percentage figure blends together.
Sorting accuracy in PPM is the number of defective parts that pass the sorter per million parts inspected, and it only means something when read next to the false reject rate, the share of good parts wrongly ejected, and the yield, the share of good parts that reach the accept stream. A machine escaping 25 PPM while discarding 0.2 percent of good product is not the same as one escaping 200 PPM with near-zero overkill, even if both are sold as 99.9 percent accurate.
The sections below separate the three numbers, show how to calculate each from ordinary production counts, and explain why factory results rarely match the demonstration room.
What sorting accuracy in PPM actually measures
Accuracy in PPM is a defect rate restated as an absolute count per million parts inspected, which turns a percentage into a quantity that can be multiplied by volume, priced against material cost and compared with a customer’s acceptance limit. High-volume suppliers adopted the unit for exactly this reason: percentages compress the interesting range into two decimal places, where 99.9 and 99.99 look almost identical while differing tenfold in escaped defects.
Why a percentage hides the problem
A claim of 99.9 percent accuracy sounds close to perfection. It also means 1,000 defective parts per million shipped, or twenty thousand escapes a year for a plant inspecting twenty million parts. That number generates containment sorting, freight charges and a scorecard conversation.
| Quoted accuracy | Escape rate | Escaped parts per million |
| 99 percent | 1 percent | 10,000 |
| 99.9 percent | 0.1 percent | 1,000 |
| 99.99 percent | 0.01 percent | 100 |
| 99.999 percent | 0.001 percent | 10 |
The unit itself is defined in the standard reference on parts-per notation, and one PPM equals 0.0001 percent, so each decimal place carries real money.
The formula and the two directions it can point
Accuracy in PPM is one ratio scaled to a million, but a sorter produces two output streams, and the choice of numerator decides which risk is being described. Escape PPM, calculated on the accept stream, measures defects that left the machine and is what customers experience. Reject PPM, calculated on the reject stream, mixes real defects with good product and therefore says nothing about accuracy on its own. Overkill PPM, calculated on the feed, measures good parts destroyed per million inspected, which is what the plant pays for. A single PPM figure quoted without its base is a slogan, not a specification.
Targets also imply process capability rather than inspection effort alone. A 64 PPM defect level corresponds to a capability index of 1.33, and 0.6 PPM to 1.66, per the NIST/SEMATECH handbook on process capability. A 20 PPM target is therefore a claim about the process feeding the sorter as much as about the sorter itself, because the machine can only remove what its optics resolve and its ejectors reach.
How PPM, false reject rate and yield fit together
PPM, false reject rate and yield are three projections of one set of inspection decisions, so they must be read together, because any one of them can be improved by quietly degrading the other two. Every part crossing the detection zone lands in exactly one of four categories, and each category has a different owner and a different cost.
The four outcomes of every inspection decision
| Sorter decision | Part is good | Part is defective |
| Ejected | False reject, or overkill. Producer cost. | Correct rejection |
| Accepted | Correct accept | Escape, or false accept. Customer cost. |
Collapsing the two error cells into one accuracy percentage is how a machine with excellent detection and poor overkill gets sold as equivalent to its opposite. The errors also respond differently to adjustment: tightening a threshold trades escapes for overkill almost one for one, while better optics, lighting or part spacing can reduce both at once.
The three formulas
Once parts leaving the reject bin are physically re-examined and classified, all three metrics follow from counts, and they reconcile because they share the same denominator logic.
- False reject rate: good parts ejected divided by total good parts inspected, times 100.
- Yield: good parts reaching the accept stream divided by total good parts in the feed, times 100.
- Purity: good parts in the accept stream divided by total parts accepted, times 100, which is the complement of escape PPM.
A sorter described as 98 percent accurate might deliver 98 percent purity with 85 percent yield, or 95 percent purity with 98 percent yield. Those are different machines for different economics.

Calculating real sorting accuracy from production data
Real accuracy comes from five counts taken over a defined production window, not from a specification sheet: the feed, the accept stream, the reject stream, the verified defects inside the reject stream, and the verified good parts inside the same stream. Recording all five is what separates a defensible quality report from an estimate, and the arithmetic that follows is simple once they exist.
The five counts you must record
- Total parts or mass entering the sorter.
- Total parts or mass in the accept stream.
- Total parts or mass in the reject stream, reconciled against the first two within counting tolerance.
- Rejected parts that are genuinely defective, from a physical inspection of the reject stream.
- Rejected parts that are conforming, from the same inspection.
Two errors are common and both flatter the result: reporting the reject stream as a percentage of the feed without decomposing it, and skipping the reject bin audit, which makes the false reject rate invisible and the escape rate unverifiable.
A worked example at one million parts
Take one million parts with a 0.5 percent incoming defect rate, a sorter detecting 99.5 percent of defects, and a false reject rate of 0.2 percent of good parts.
| Stream or metric | Calculation | Result |
| Defective parts in feed | 1,000,000 × 0.005 | 5,000 |
| Good parts in feed | 1,000,000 − 5,000 | 995,000 |
| Defects correctly rejected | 5,000 × 0.995 | 4,975 |
| Escapes | 5,000 − 4,975 | 25 |
| Good parts falsely rejected | 995,000 × 0.002 | 1,990 |
| Total reject stream | 4,975 + 1,990 | 6,965 |
| False reject rate | 1,990 ÷ 995,000 | 0.20 percent |
| Yield | 993,010 ÷ 995,000 | 99.80 percent |
| Escape PPM | 25 ÷ 993,035 × 1,000,000 | 25 PPM |
The headline reject rate of 0.70 percent is nearly useless, because 29 percent of that stream is saleable product. The numbers that matter are 25 PPM on the customer side and 1,990 good parts destroyed per million on the plant side, and neither appears in a reject rate report.
Why re-inspection loops change the number
A manual re-inspection station downstream will improve the escape figure at once, since operators recover part of the 25 escapes, but it adds a second set of hands with its own error rate and cost per part. Reports should therefore separate line PPM, what the sorter delivers, from shipped PPM, what the customer receives after rework. Blending the two yields a figure that evaluates neither the equipment nor the labour.

Why nameplate accuracy does not survive the factory floor
Nameplate accuracy is measured under conditions the machine will not see again, and it degrades on a production line because dust, vibration, drifting light and batch variation each attack a different part of the detection chain. The demonstration room offers stable temperature, clean optics, one part type and a feed rate chosen to look good rather than to run.
Presentation and singulation
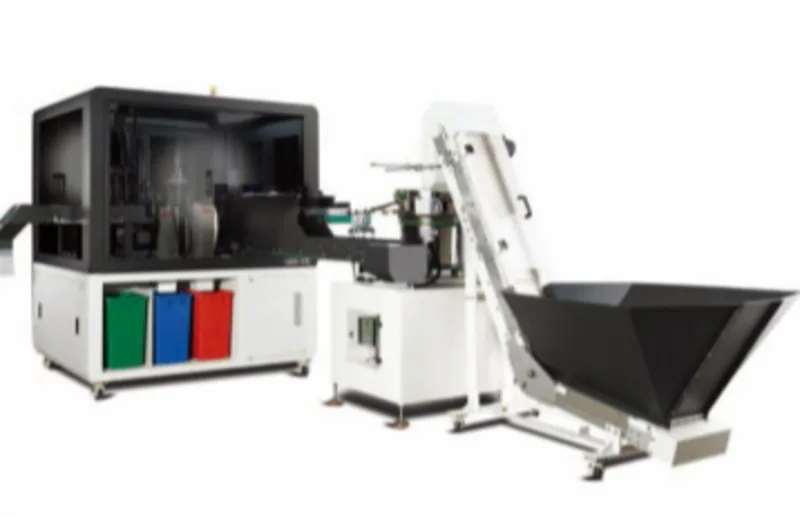
A sorter can only classify what it sees separately. Overlapping parts hide each other, and parts spaced closer than the ejector pitch are removed together, so one contaminant takes a good neighbour with it. Feed rate, monolayer quality and valve pitch therefore set a floor on the false reject rate that no algorithm tuning can go below. Machines that carry parts on a belt hold spacing more consistently than chute-fed designs, which is why a belt-type optical sorting machine is often specified where overkill cost dominates.
Optical degradation and contamination
Dust, fibre and moisture settle on the window between lens and product. The resulting haze reads, to a threshold-based classifier, as discoloration, so ejectors fire on clean parts. Light-emitting diode output also declines over thousands of hours, shifting the colour baseline every threshold was calibrated against. Neither failure raises an alarm; both raise overkill slowly, and operators compensate by loosening sensitivity, which converts overkill into escapes.
Vibration, ambient light and batch variation
Floor vibration from upstream presses blurs edge pixels, and blurred edges read as dimensional irregularity. Daylight through open bay doors shifts colour temperature across a shift, so a threshold set at 8 a.m. misclassifies at 4 p.m. A new coating batch changes surface reflectance and invalidates a recipe nobody re-validated. These effects compound, which is why factory false reject rates often run several times above demonstration values.
When sorting cannot fix the process
Sorting separates only what is separable. If contamination is distributed evenly across a lot, no cut point isolates a clean fraction, and raising the rejection rate destroys yield without improving quality. Published work on low-cost grain sorting shows the ceiling: rejection rates of 23 to 28 percent were needed to shift contaminant distribution, and in one heavily contaminated sample set no clean fraction existed at all. Measure the incoming defect distribution first, then set the target, then choose equipment.
The economics of one thousand PPM
One thousand PPM is a position on a trade-off curve rather than a moral failing, and the right position depends on whether escapes or overkill cost more in your application. Because the two errors are priced in different currencies, purchasing and quality often disagree about the same machine.
Cost of escape
An escaped defect is cheap to produce and expensive to discover. Visible cost covers containment sorting at the customer, freight, administrative charges and, in regulated categories, batch quarantine. Hidden cost covers the engineering time spent proving containment and the reduced willingness to award new business. For safety-critical parts a single escape can trigger a corrective action costing more than a year of overkill, which is why automotive fastener sorting programmes target escape levels an order of magnitude below general industrial work.
Cost of overkill
Overkill is paid in material, labour and capacity, and it is usually undercounted because the material was already purchased. A line processing ten tonnes per hour at a 2 percent false reject rate discards 200 kilograms of saleable product every hour, or 3.2 tonnes across two shifts. In piece goods, 1,990 parts per million at twenty million units a year is roughly 39,800 units, plus the handling and re-inspection attached to them.
Finding the economic operating point
Total cost is U-shaped: escapes fall as sensitivity rises, overkill rises, and the sum bottoms out somewhere between. That minimum moves with part value, penalty terms and labour rates, so recipes copied between plants rarely perform.
| Operating mode | Escape target | Rechazo falso | Yield | Typical application |
| Purity first | Under 10 PPM | 1.5 to 3 percent | 96 to 98 percent | Safety-critical, regulated |
| Balanced | 20 to 50 PPM | 0.3 to 1 percent | 99 to 99.5 percent | General industrial |
| Yield first | 100 to 300 PPM | Under 0.2 percent | Above 99.5 percent | High material value |

How to validate sorting accuracy before and after installation
Validation replaces the demonstration with an experiment designed so that a bad machine cannot pass it, using seeded defects, statistically sized samples and acceptance criteria written into the contract. Each element closes a specific loophole in a vendor’s own test report.
The seeded-defect protocol
- Draw a production sample large enough to detect the target escape level: proving 50 PPM with 95 percent confidence needs roughly 60,000 parts with zero escapes.
- Seed known defects across every class the machine must catch, including borderline cases, recording exact counts.
- Randomize so operators cannot identify seeded parts, and run at production feed rate and speed.
- Reconcile seeded parts detected against seeded parts total, class by class, and count good parts ejected during the same run.
- Repeat across three runs and three shifts, then report the range rather than the best result.
Sampling logic matters as well. Lot acceptance sampling under ISO 2859-1 protects a customer against a bad lot; it does not establish a machine’s PPM capability, and a table intended for the first purpose will pass almost any machine on the second.
Acceptance criteria worth writing into the contract
| Criterio | Specification example | Verification method |
| Escape level | 50 PPM or better | Seeded trial, 60,000 parts, 3 runs |
| False reject rate | 0.5 percent or lower | Reject bin audit, 3 shifts |
| Yield | 99.3 percent or better | Count or mass balance, 8 hours |
| Repetibilidad | Spread within 20 percent | Comparison of the 3 runs |
| Change control | Every threshold change logged and re-validated | Recipe history audit |
The funciones de inspección visual offered should map one to one onto the defect classes in the seeded trial; a class with no matching function is an acceptance gap, not a training issue. Monitoring then follows a fixed rhythm: daily escape PPM against target, weekly audit of a few hundred rejected parts to keep the false reject estimate current, and a scheduled optics and illumination check that catches degradation before it appears as overkill.
PREGUNTAS FRECUENTES
What escape PPM should a sorting specification actually target?
Set the target from the customer’s process, not from a brochure. A common industrial norm for conventional high-volume supply is around 200 PPM, with 100 percent optical inspection used to reach roughly 20 PPM or better. The binding constraint is proof: claims below about 50 PPM require tens of thousands of inspected parts to demonstrate, so a target tighter than the verification budget cannot be audited and will not be enforced.
How can the false reject rate be estimated if the reject stream is too large to inspect fully?
Audit a stratified sample instead of the whole bin. Pull 300 to 500 parts across shifts, part types and time of day, classify each by hand or on a measuring stage, then weight the results by each stratum’s share of the reject stream. Because that stream is deliberately enriched with defects, the sampled proportion of conforming parts estimates the false reject rate, not the incoming defect rate, and confusing the two is the most frequent source of inflated accuracy claims.
Does raising sorting accuracy always cost yield?
No. Only threshold adjustment trades one error for the other. Better illumination uniformity, cleaner optics, tighter part spacing and retrained classifiers reduce escapes and overkill at the same time, because both errors come from the same uncertainty about what the sensor saw. Yield loss becomes unavoidable only when the machine is pushed past the resolution of its optics or the singulation its feed system can deliver, which is a mechanical limit rather than a software setting.